
This article shows you how JOINTION handles opal glass tableware quality control — from the moment raw materials hit the factory gate to the last carton leaving the warehouse. The opal glassware quality control process boils down to three hard checkpoints. AAS spectroscopy catches impurities at the raw material stage. Microscopy verifies crystalline phase structure during production. And a full round of performance and appearance sampling follows AQL standards before anything ships. Every checkpoint has a clear data threshold. Miss it, and the batch stops. No exceptions, no gray area.
Where Does JOINTION’s Quality Control Begin?
It starts before raw materials even enter the factory. At the supplier shipping stage, JOINTION already has chemical composition admission criteria and supplier qualification thresholds in place for core materials — silica sand, opacifiers, and fluxes. Once materials arrive at the warehouse, they still cannot go straight into the melting furnace. They first pass through batch weighing verification, mix homogeneity confirmation, and a pre-feeding sign-off. New formulations face an extra gate: laboratory pilot-scale verification. Below is the full chain of opal glass raw material testing, from source to production line.
Raw Material Admission Thresholds Set Before Materials Even Arrive
The core raw materials for opal glass tableware are fairly straightforward. Silica sand (SiO₂) forms the glass body. Opacifiers — fluorides like calcium fluoride (CaF₂) and cryolite, or phosphates like calcium phosphate — create the milky white color. Fluxes and stabilizers, mainly soda ash (Na₂CO₃) and limestone (CaCO₃), control melting behavior and durability. Not a long list. But every one of them has to stay within tight specs, because even small shifts in purity pass straight through to the finished product.
If the iron in silica sand runs just 0.05% too high, the entire furnace of glass turns yellow. If the opacifier ratio drifts, whiteness jumps around from batch to batch. If flux impurities creep up, melting temperature and glass homogeneity both suffer. That is why JOINTION sets hard chemical thresholds for each core material and starts gatekeeping before the supplier even loads the truck.
Here are the key admission specs currently in place:
Silica Sand (SiO₂): SiO₂ content must be 99% or above. Iron oxide (Fe₂O₃) must stay below 0.05%. This directly targets the whiteness and color consistency that tableware-grade opal glass demands. Once iron tips over the limit — even with every process parameter held constant — the glass comes out of the furnace visibly greenish or yellowish. In a matched dinnerware set, that means the whole batch is rejected.
Opacifiers (Fluoride/Phosphate Types): Active ingredient content (for example, CaF₂ purity) and batch-to-batch compositional swing both have quantitative caps. The goal is to keep the microcrystalline phases that form inside the glass consistent in size and density, so every batch hits the same milky white. The opacifier is the single ingredient that separates opal glass from ordinary clear glass. If its consistency slips, whiteness alignment across batches falls apart.
Fluxes and Stabilizers (Soda Ash, Limestone, etc.): Each auxiliary material has its own purity floor and impurity ceiling. Anything that misses the mark does not get accepted into the warehouse. These materials do not show up in the product’s appearance directly, but their impurity levels shift the melting temperature and chemical uniformity of the glass liquid — and that feeds into the strength and surface feel of the final piece.
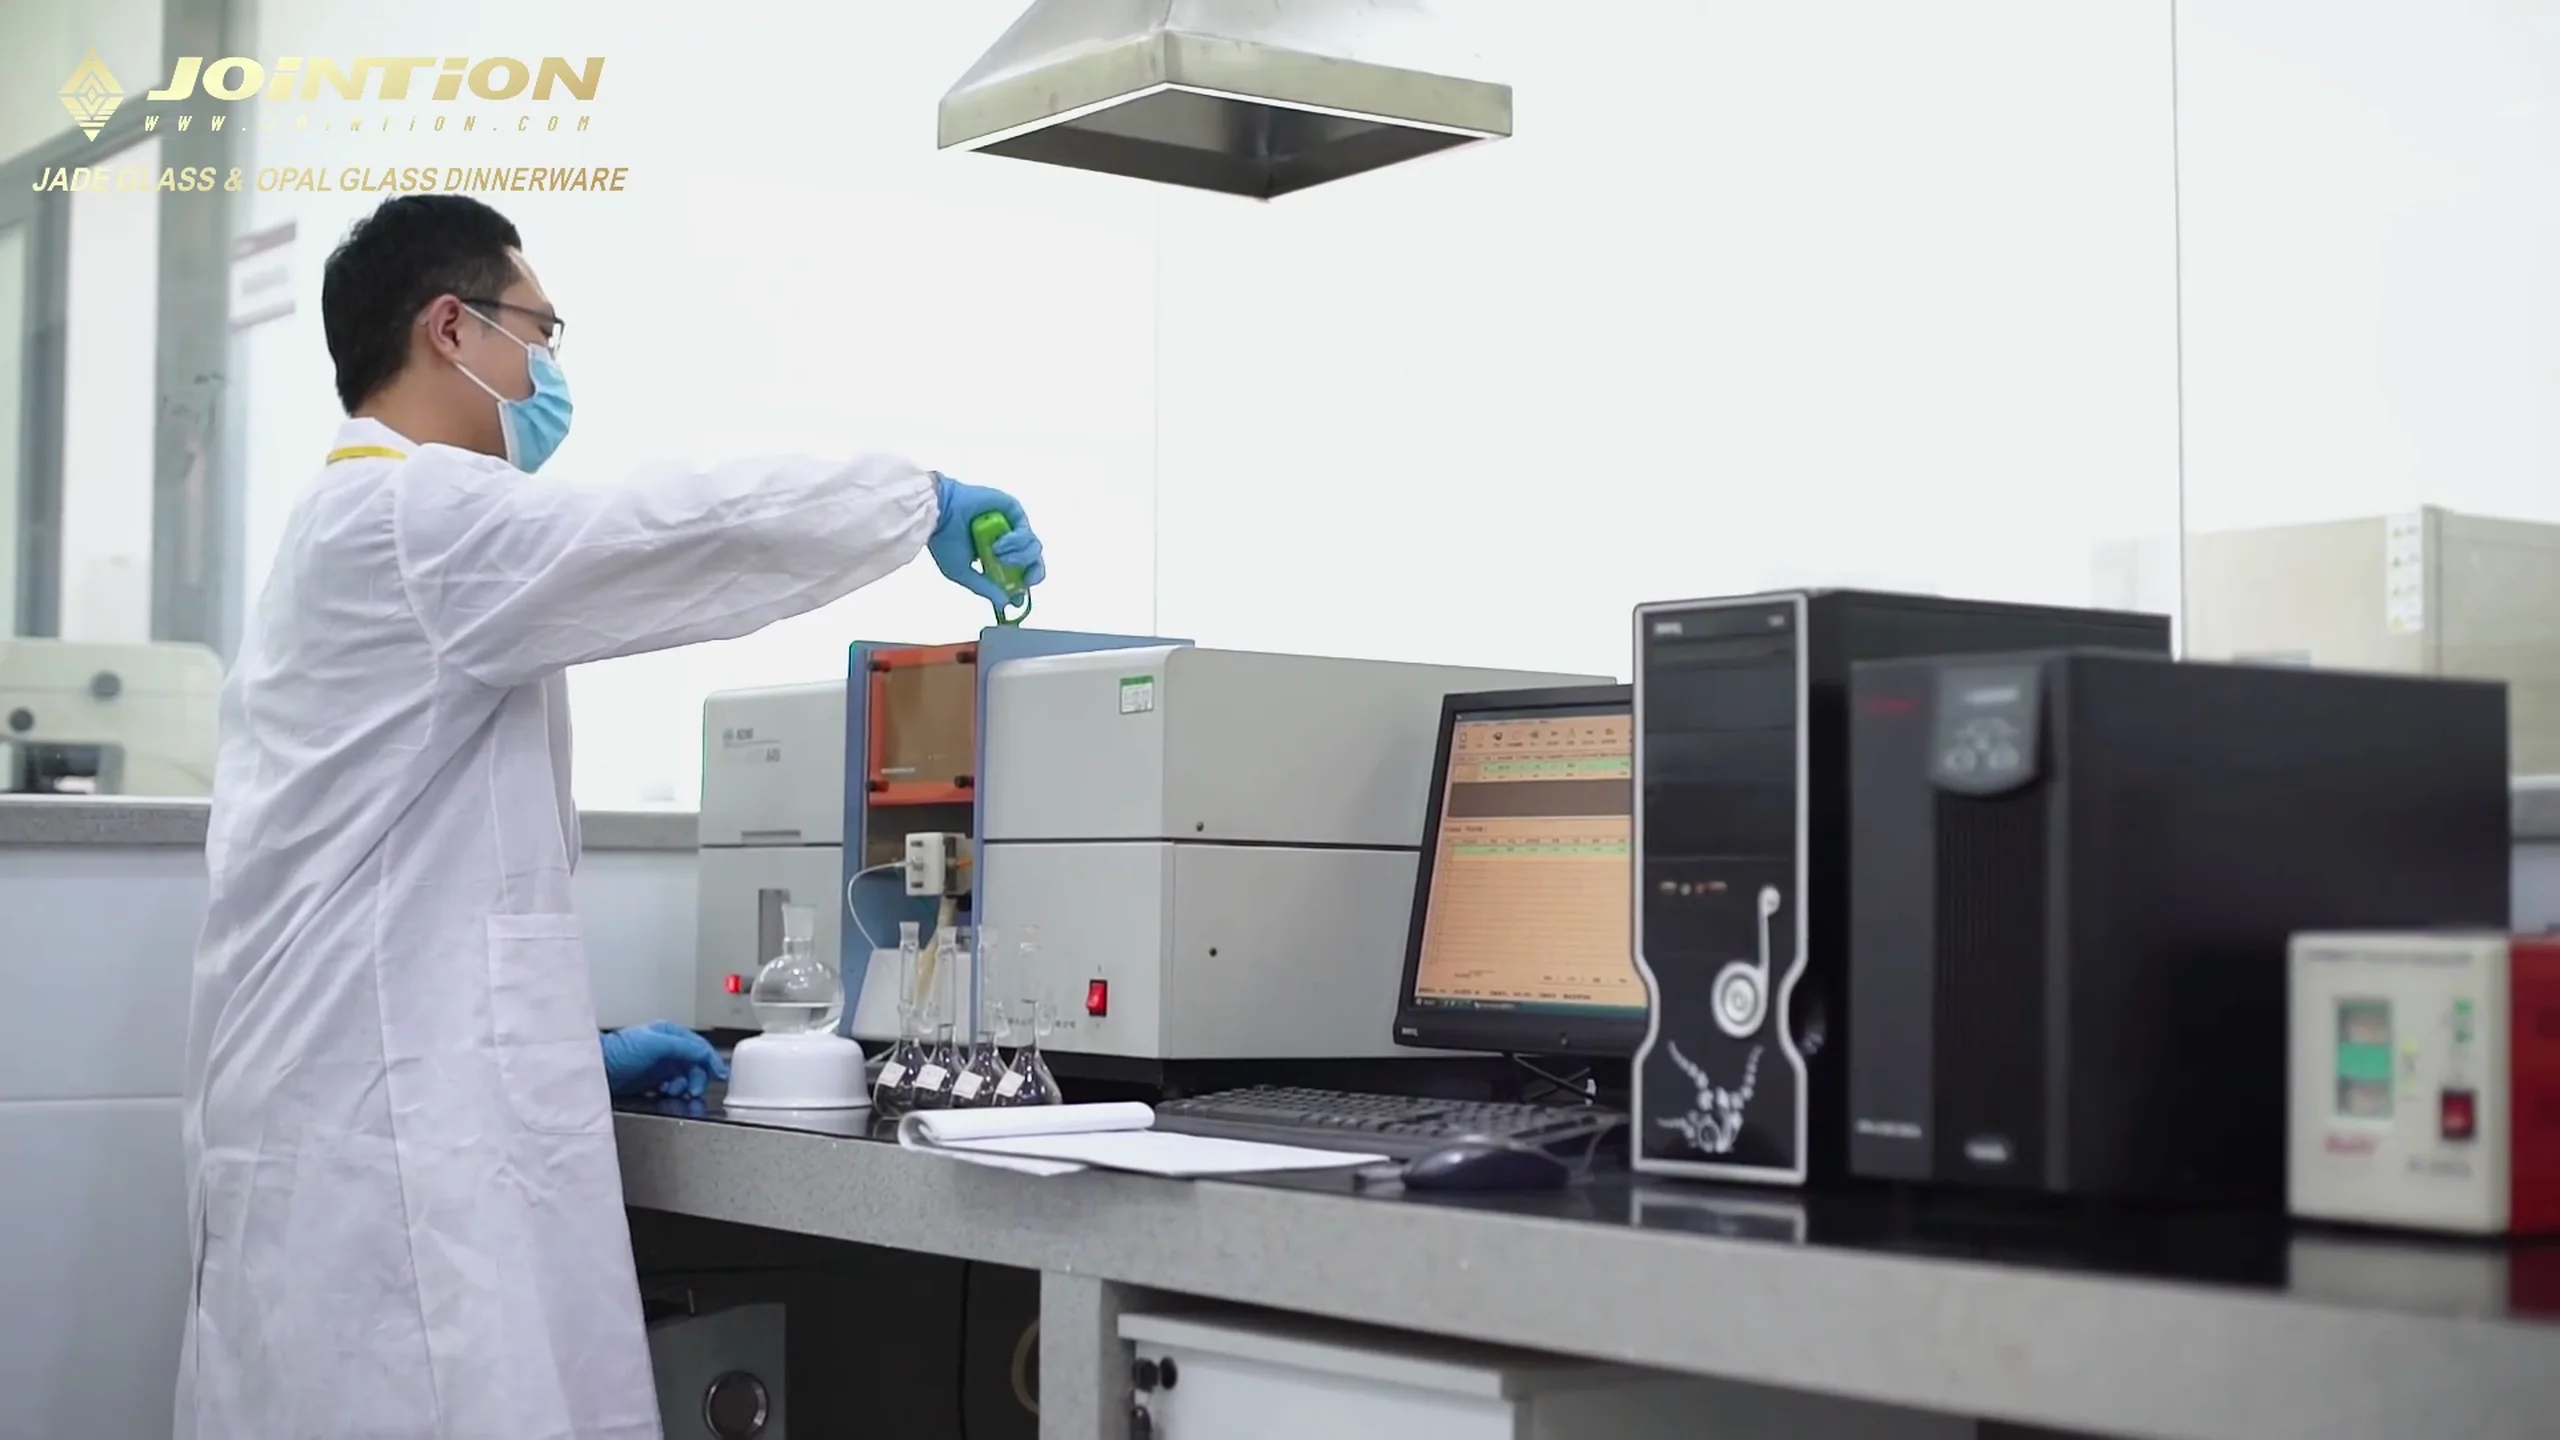
The image below shows the Atomic Absorption Spectrophotometer (AAS) in the lab, used for quantitative raw material analysis. Every chemical threshold listed above is verified batch by batch through this instrument before any material is cleared.
Specs on the material itself are only half the story. JOINTION also sets qualification bars at the supplier level. To land on the approved list, a supplier needs a stable ore source or production line, a solid outgoing inspection system, and traceable third-party test reports. Periodic re-audits are mandatory. If a supplier’s materials flag compositional deviations on consecutive incoming inspections, supply gets suspended — or the supplier is dropped from the list entirely.
A real example: one batch of limestone showed elevated iron during incoming inspection. The QC team caught it, traced the cause, and found the supplier had quietly switched ore sources without notifying anyone. The entire truckload was sent back, and that supplier landed on a priority watch list. After that incident, the team tightened its supplier ore-source change reporting rules even further. The standard is in place before raw materials are loaded.
A Full Round of Verification Between Incoming Materials and Production Start
Passing incoming inspection and sitting in the warehouse does not mean a material can go straight into the furnace. Between warehouse release and actual hot forming, JOINTION runs another round of checks across three steps: batch weighing, mixing and blending, and pre-feeding confirmation. The point is simple — make sure what actually enters the furnace matches the process formulation exactly, with no room for weighing errors, uneven mixing, or shifts in material condition.
At the batch weighing step, high-precision electronic scales weigh each raw material one by one. Every data point is logged in real time and compared automatically against the formulation standard. If any material’s actual weight falls outside the set tolerance, the system triggers an alarm and locks down the batch on the spot. Nothing moves forward.
Next comes mixing and blending. The focus here is homogeneity — all materials must reach uniform compositional distribution after blending. No “clumps” where opacifier concentration is too high in one spot and too low in another. Once mixing is done, there is still one more gate before feeding: a pre-feeding confirmation. The team reviews the batch’s weighing records, mixing time, and blending parameters against the process card. Everything checks out, then — and only then — does sign-off release happen.
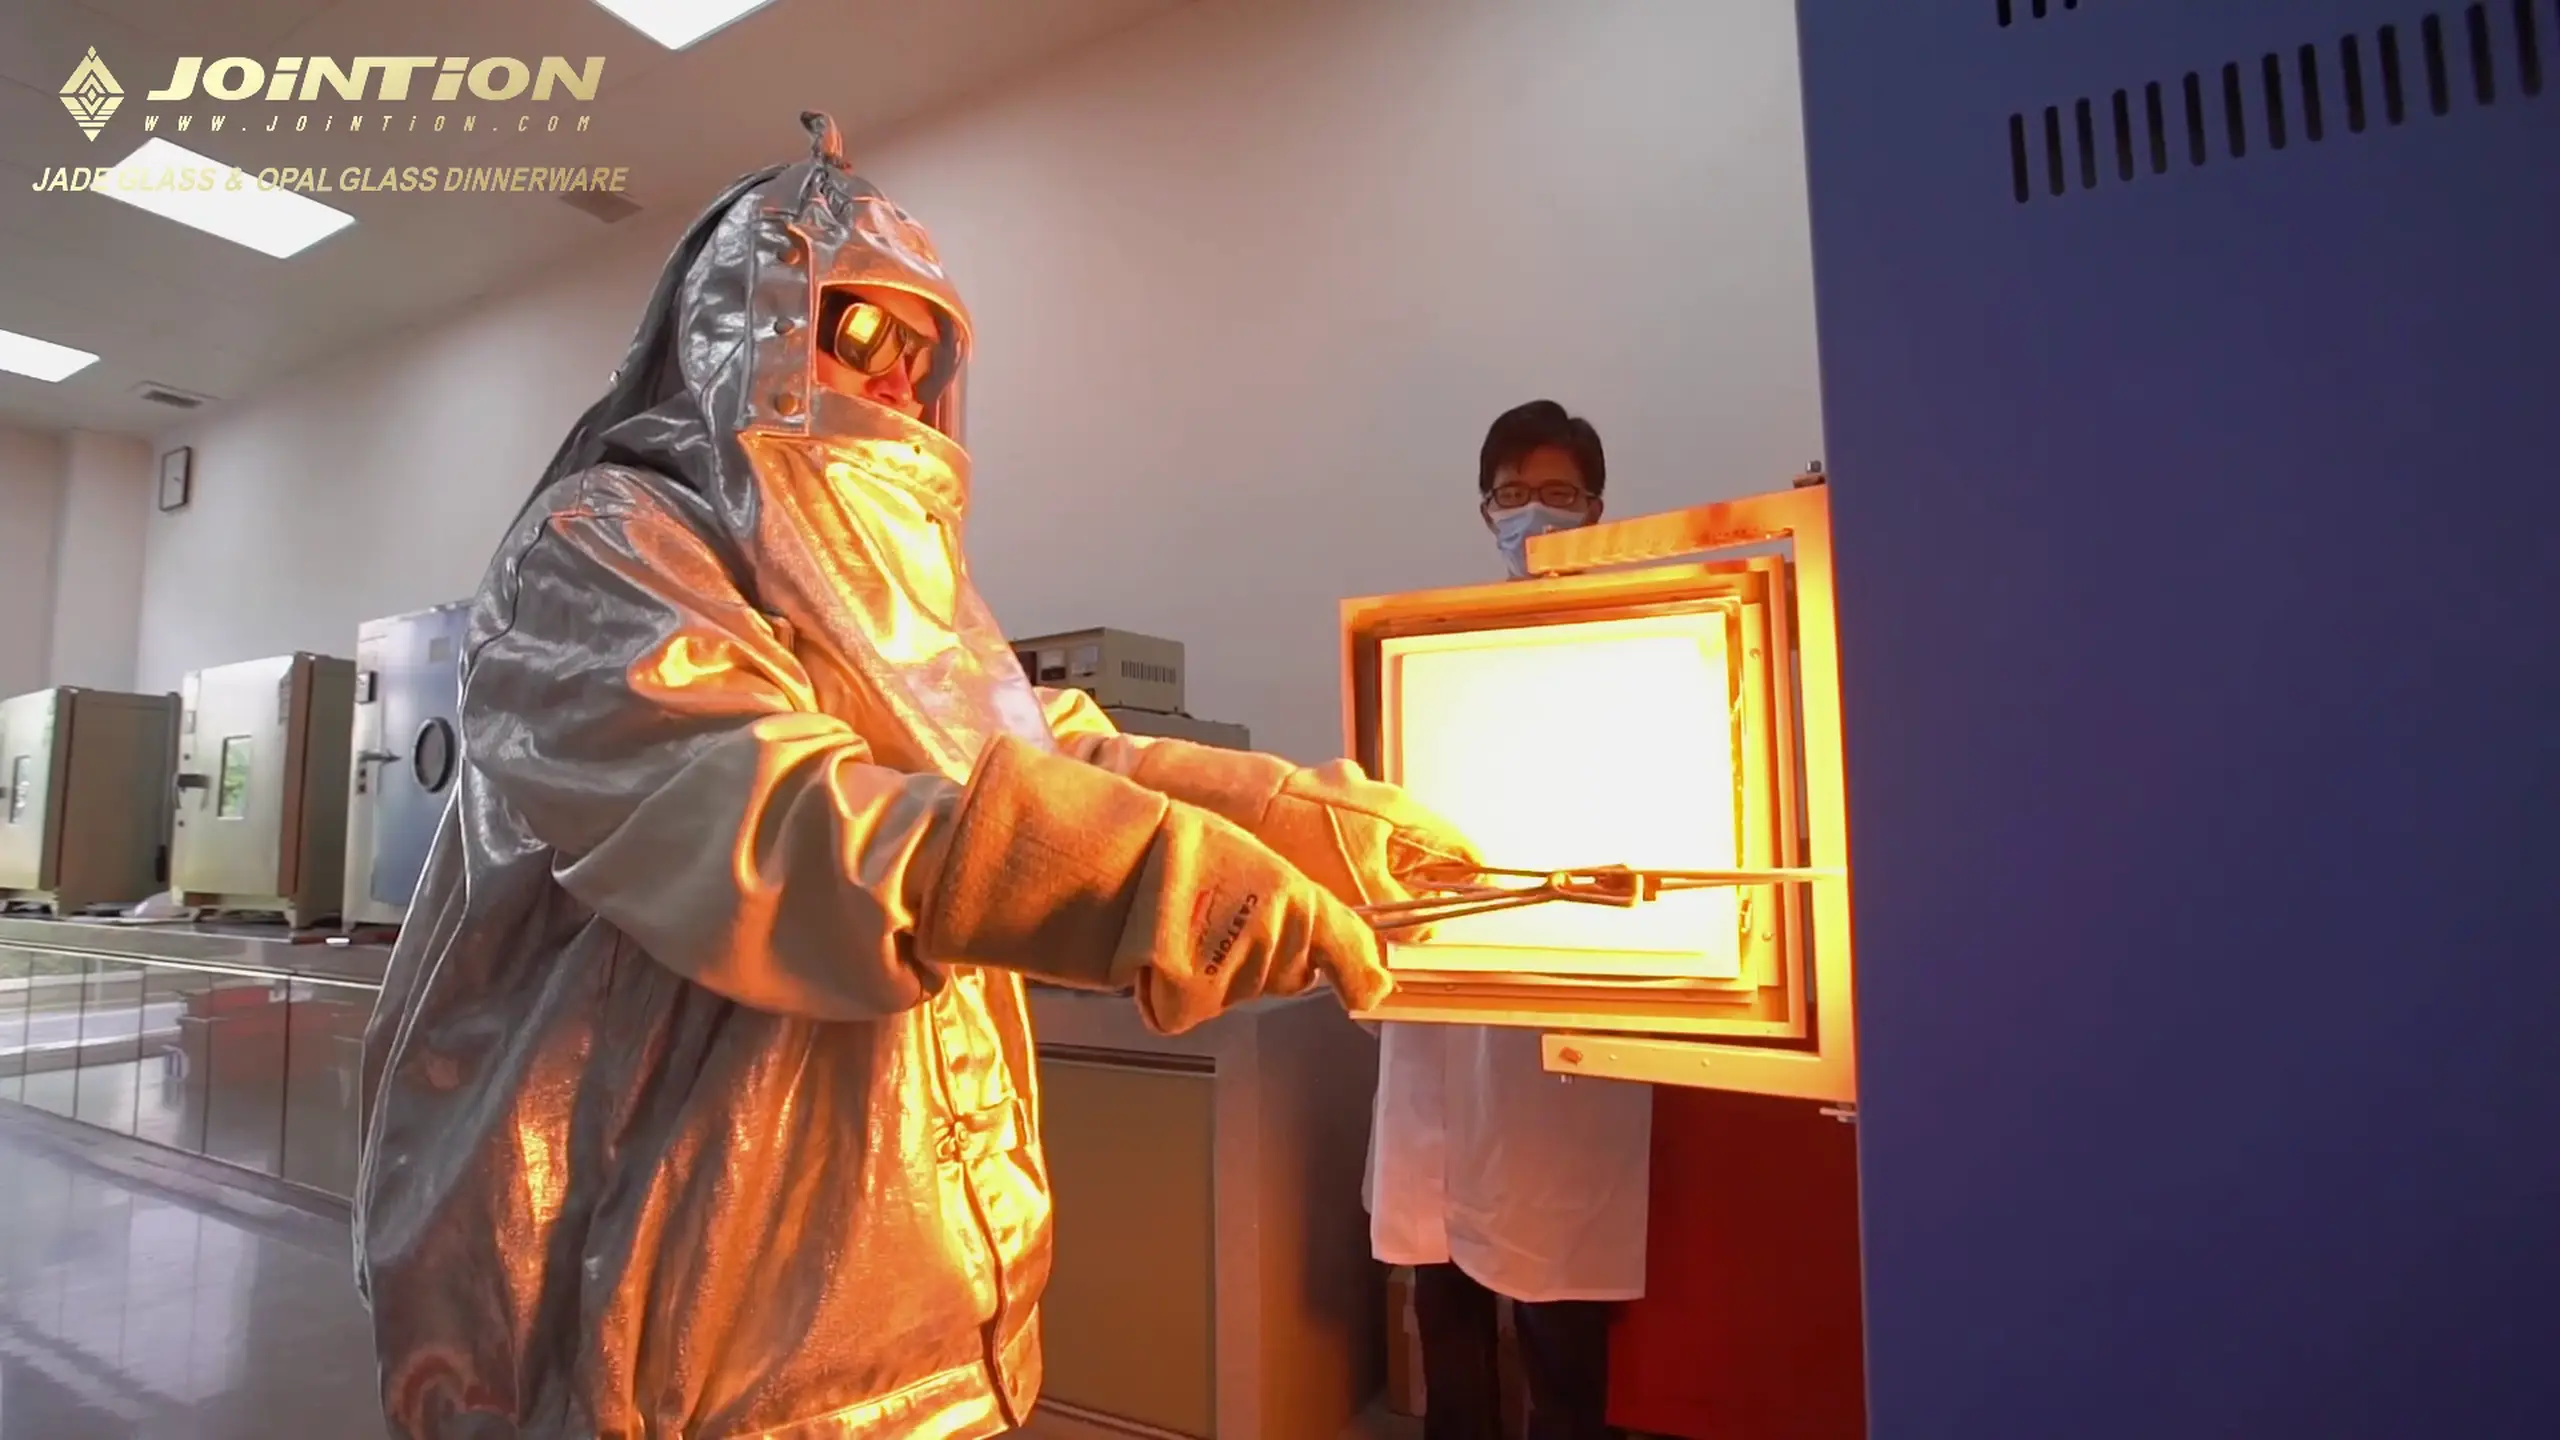
For new vessel types or new formulations, the gatekeeping goes even further back. Before the standard weighing-mixing-feeding flow starts, the R&D center runs a pilot-scale verification in the lab. The team melts small samples in a high-temperature box resistance furnace, checking how the formulation behaves and flows at 1400°C–1500°C. This confirms the raw material combination can actually form properly under real high-temperature conditions.
After that, a dilatometer measures the thermal expansion coefficient of the test samples at high precision. Opal glass tableware has to handle rapid temperature swings — microwave to countertop, oven to table. For that to work, the expansion coefficient must land precisely within the design window. If the number is off at the R&D stage, the formulation gets killed. It never reaches mass production. Otherwise, you end up with thousands of pieces that crack the first time they see a temperature change.
Only after every lab test clears does a new formulation get handed to the production line for standard QC execution. So the pre-feeding gatekeeping is not just a rubber-stamp review of mature recipes. Whenever a new variable enters the picture, a laboratory-grade safety net is already there.
The image below shows the high-temperature box resistance furnace and small-sample melt testing area in the R&D lab. Once a formulation clears melt behavior and formability at this step, it moves to the next critical test — thermal expansion coefficient measurement.
Here is a full summary of every quality control checkpoint between warehouse release and furnace feeding — a core part of the opal glass production quality management system:
| QC Checkpoint | What Happens | Why It Matters |
|---|---|---|
| Batch Weighing | Each material weighed on high-precision scales; data auto-compared to tolerances; out-of-range triggers alarm and lockdown | Kills formulation drift from weighing errors |
| Mixing & Blending | Blended at specified duration and speed until composition is uniform throughout | Prevents patchy whiteness from uneven opacifier concentration |
| Pre-Feeding Confirmation | Batch records and mixing parameters reviewed; sign-off only after full compliance | Last procedural safety net — no step gets skipped |
| New Formulation Pilot Verification (new products only) | Lab furnace melt test + dilatometer expansion coefficient measurement | Proves the formula works before it hits mass production; catches thermal shock cracking risks early |
What Does JOINTION Do at Key Production Stages?
Two critical IPQC inspections run during production. First, at the raw material and pre-feeding stage, an Atomic Absorption Spectrophotometer (AAS) performs ppm-level quantitative analysis on impurity elements like iron and sodium in quartz sand. Anything with iron over the threshold is blocked from the line — no discussion. Second, after forming and annealing, microscopy checks the product’s microcrystalline phase structure, verifying that grain size and distribution meet opal glass quality inspection standards.
These two tests lock down the most failure-prone points — one at the material end, one at the semi-finished product end — so nothing non-conforming slips through to the next process. Here is how each one works in practice.
Want to understand the full production flow first — melting, forming, annealing, strengthening — before diving into where the inspections sit? This breakdown covers it end to end: Opal Glass Manufacturing Process.
Atomic Absorption Spectroscopy — Elemental and Impurity Analysis
The “jade-white” look that defines JOINTION’s opal glass tableware is largely decided before the furnace even fires up. Quartz sand — the main raw material, over 60% of the formulation — always carries trace impurities from the natural ore. The one that matters most is iron (Fe).
A difference of just a few ten-thousandths in iron content is enough to push the melted glass toward a greenish or yellowish tint. That directly wrecks the milky white that opal glass is supposed to deliver. This is not theory — it is a well-established fact across the glass industry: double the Fe₂O₃ content and the color deviation roughly doubles too. For tableware where whiteness is the core selling point, that kind of shift is a non-starter.
That is why AAS testing is a mandatory gate at both raw material intake and pre-feeding. The process follows a fixed routine, and this opal glass inspection is standardized across every batch:
Every incoming lot of quartz sand and mineral raw materials gets sampled by the QC team before warehousing. Samples go straight to the lab. There, AAS measures the concentration of key elements — iron (Fe), sodium (Na), and others — by reading their characteristic spectral absorption. Detection sensitivity reaches ppm level, picking up trace differences that no human eye or basic test can catch.
Results are compared against internal control limits. If iron is over the line, the material is rejected — no matter who supplied it or how normal it looks. Only batches that clear testing and get a formal release slip can enter the production line.
It might sound like routine incoming inspection. But this is actually the first hard gate in the entire opal glass tableware quality control chain. Let impurities through here, and at 1500°C in the furnace there is no fix. A full furnace of off-color glass means every product downstream is scrap.
We caught this in practice. One batch of quartz sand looked completely normal — color fine, texture fine. AAS flagged the iron content above the internal limit. If that batch had gone into the furnace unchecked, tens of thousands of pieces from that single melt would have missed whiteness specs. That interception drove a point home for the QC team: AAS is not a “nice-to-have when you get around to it.” It is a mandatory step written into the release flow for every single batch.
For buyers evaluating suppliers, whether a factory runs quantitative opal glass tableware testing methods at the raw material stage — and enforces hard cutoffs — tells you a lot about whether their quality system genuinely starts at the source.
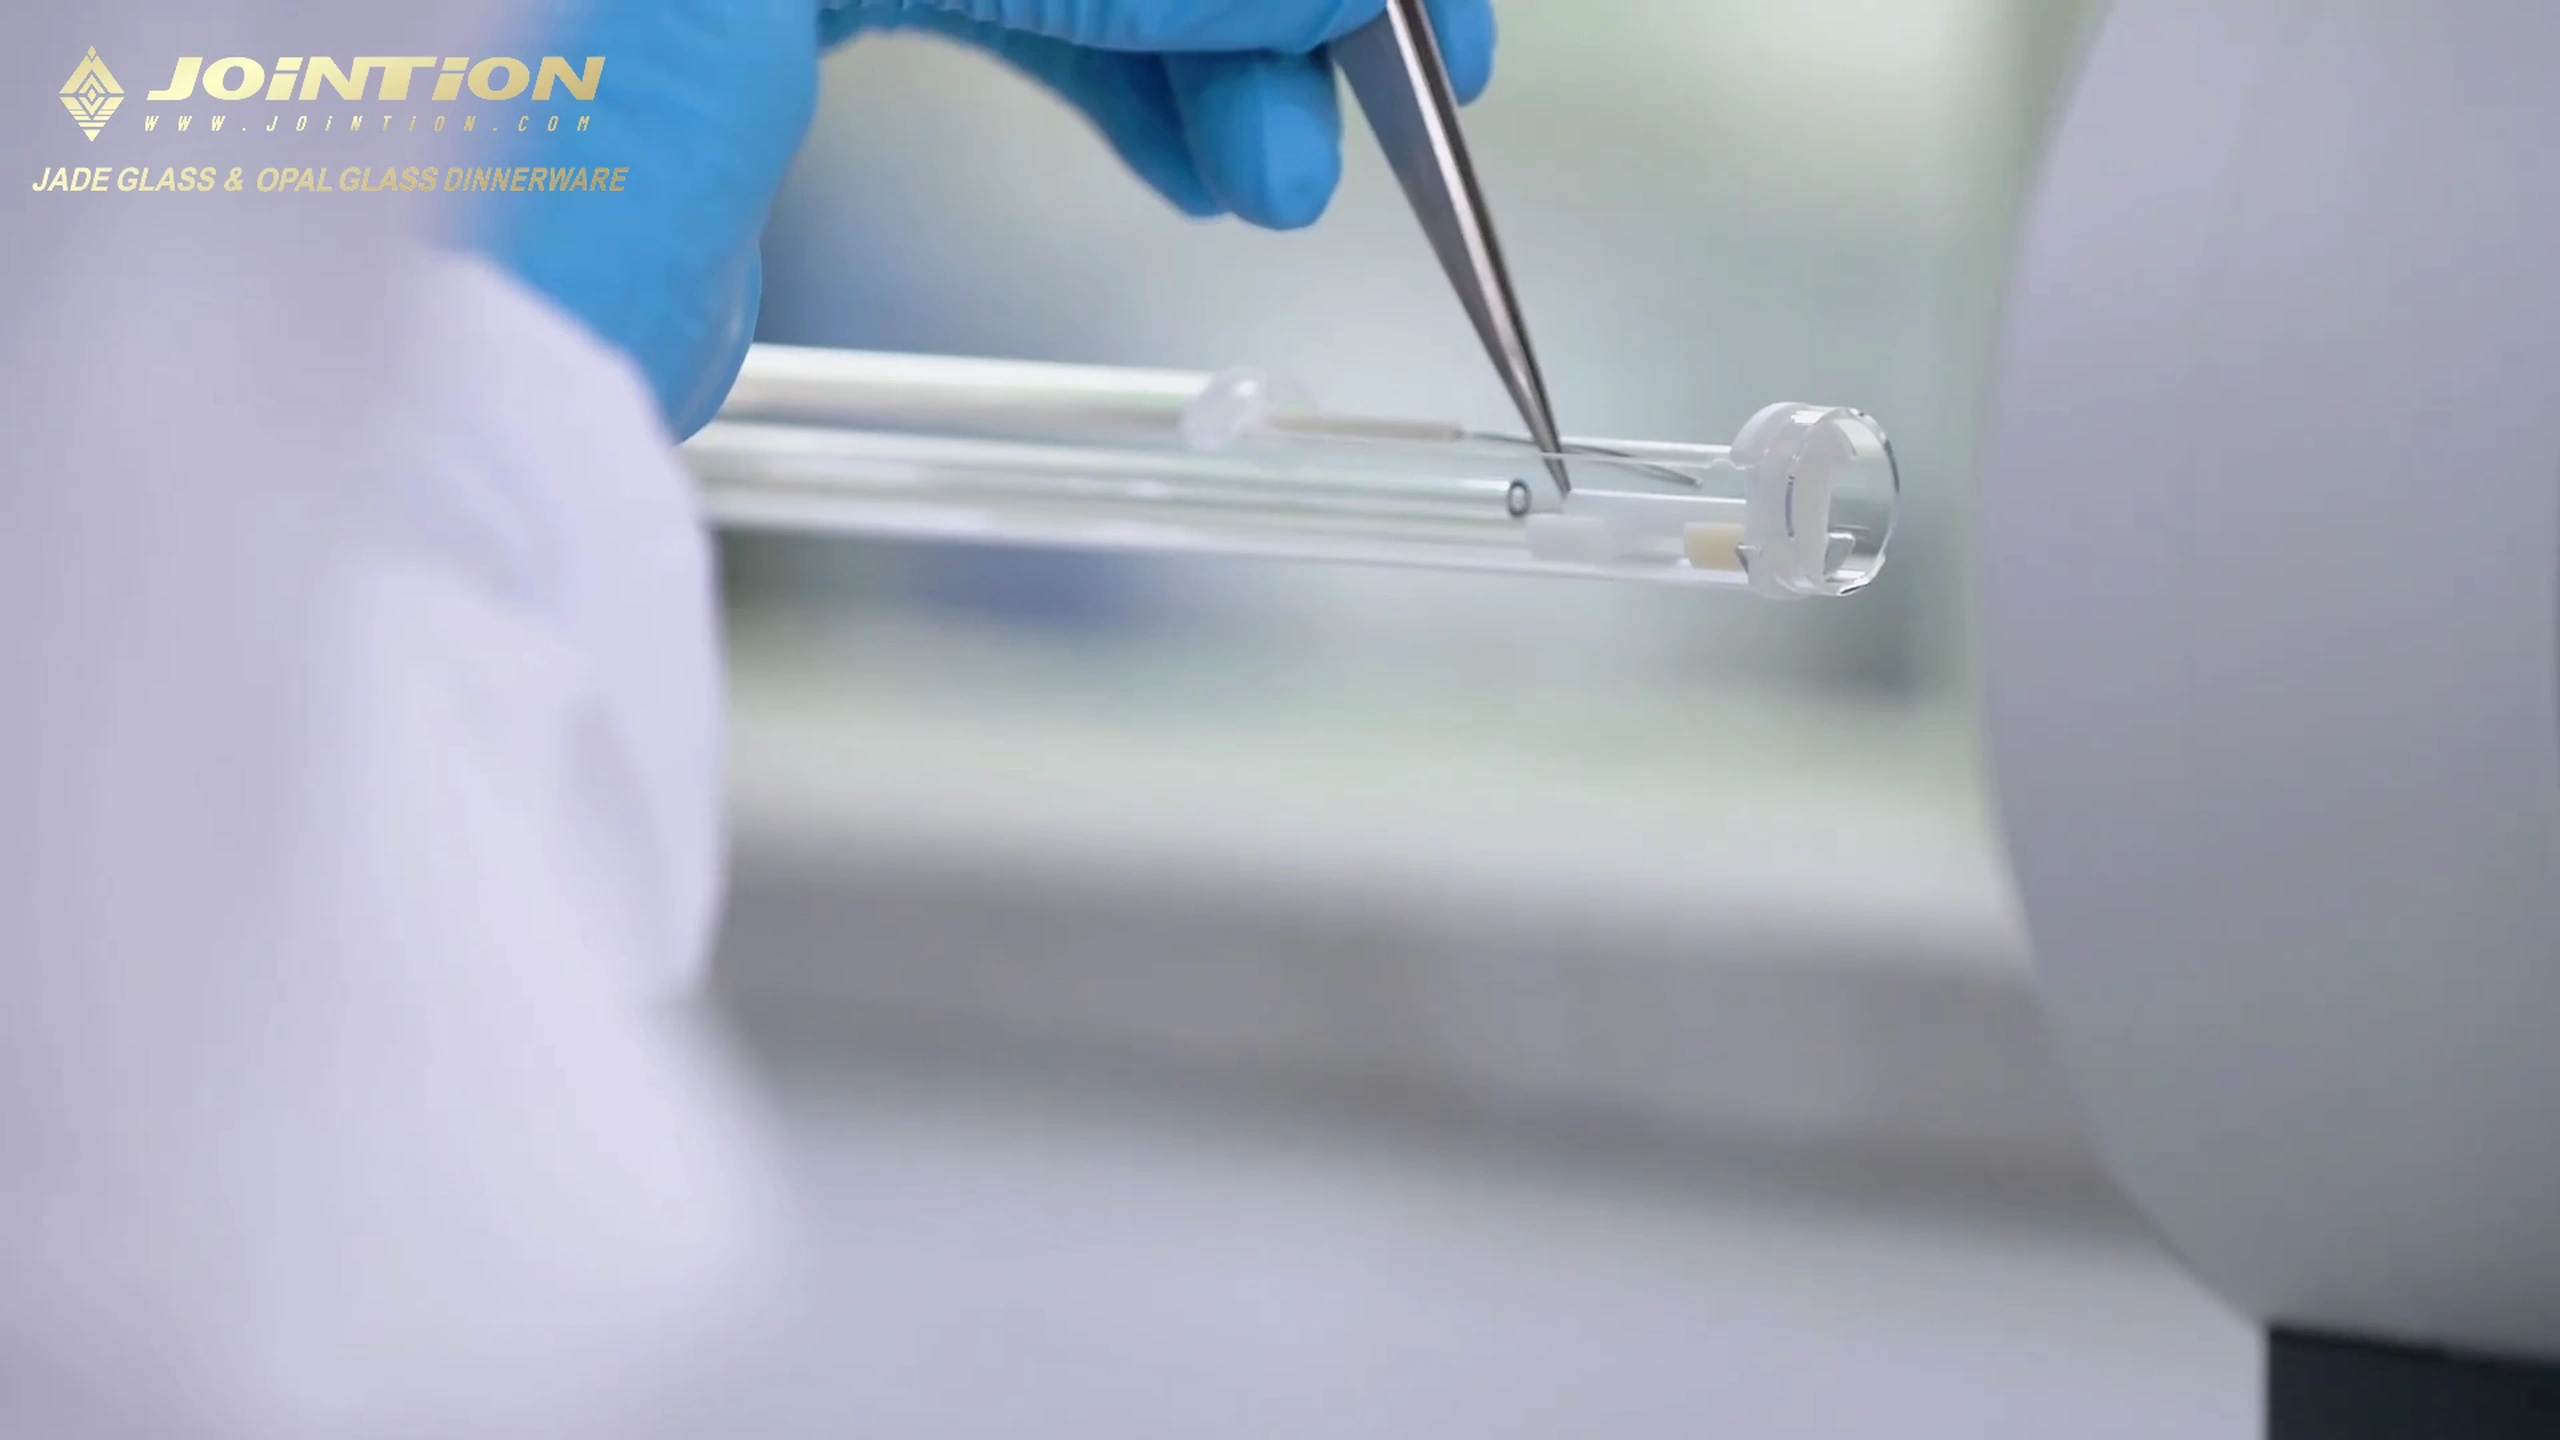
The image below shows QC staff running ppm-level elemental analysis on incoming raw material samples via AAS. This batch-by-batch mandatory testing is the front line of impurity interception.
Microscopic Microstructure Analysis
The milky white look and mechanical strength of opal glass tableware do not come from formulation and temperature alone. At the micro level, both properties depend on one thing: whether the microcrystalline phase structure that forms during annealing hits the design target. In the annealing (crystallization) stage, the opacifier separates out of the glass matrix and forms huge numbers of crystal grains at the nanometer-to-micrometer scale. Their size, shape, and how evenly they spread through the glass directly drive the product’s toughness, impact resistance, whiteness, and surface luster.
The catch is that you cannot tell whether annealing went right just by looking at the finished piece. You have to go to the microscopic scale to verify it.
After forming and annealing, the team pulls samples on a regular schedule and examines the microcrystalline phase structure under a microscope. This step sits at the center of the opal glass tableware QC workflow for semi-finished products. The table below shows what gets checked and what goes wrong when an indicator drifts out of range:
| What Gets Checked | What “Good” Looks Like | What Happens If It Drifts |
|---|---|---|
| Average Grain Size | Within the target range set by the process design (typically nanometer to micrometer) | Too large → brittle product, rough surface; too small → weak whiteness, strength falls short |
| Grain Distribution Uniformity | Evenly spread through the glass matrix, no obvious clusters or bare zones | Uneven → strength and color vary across different spots on the same piece — inconsistent quality in a single item |
| Abnormal Crystalline Phase Zones | No coarse grain clusters, no patches of under-crystallized glassy phase | Coarse clusters → localized brittle fracture risk; under-crystallized areas → noticeably weaker strength and heat resistance in that zone |
This microscopic check is a direct read on whether the annealing process actually performed as designed. The furnace temperature curve might be set perfectly on paper. But if a specific run drifts — equipment fluctuation, a change in how densely products are loaded — only microstructure analysis will catch it in time.
This inspection runs as a routine IPQC node after forming and annealing. Every batch has its internal crystalline phase confirmed compliant before it moves into subsequent strengthening. For buyers, whether a supplier can inspect at the microstructure level during production — not just “look and touch” at final inspection — is a direct signal of how deeply they control the product’s intrinsic quality.
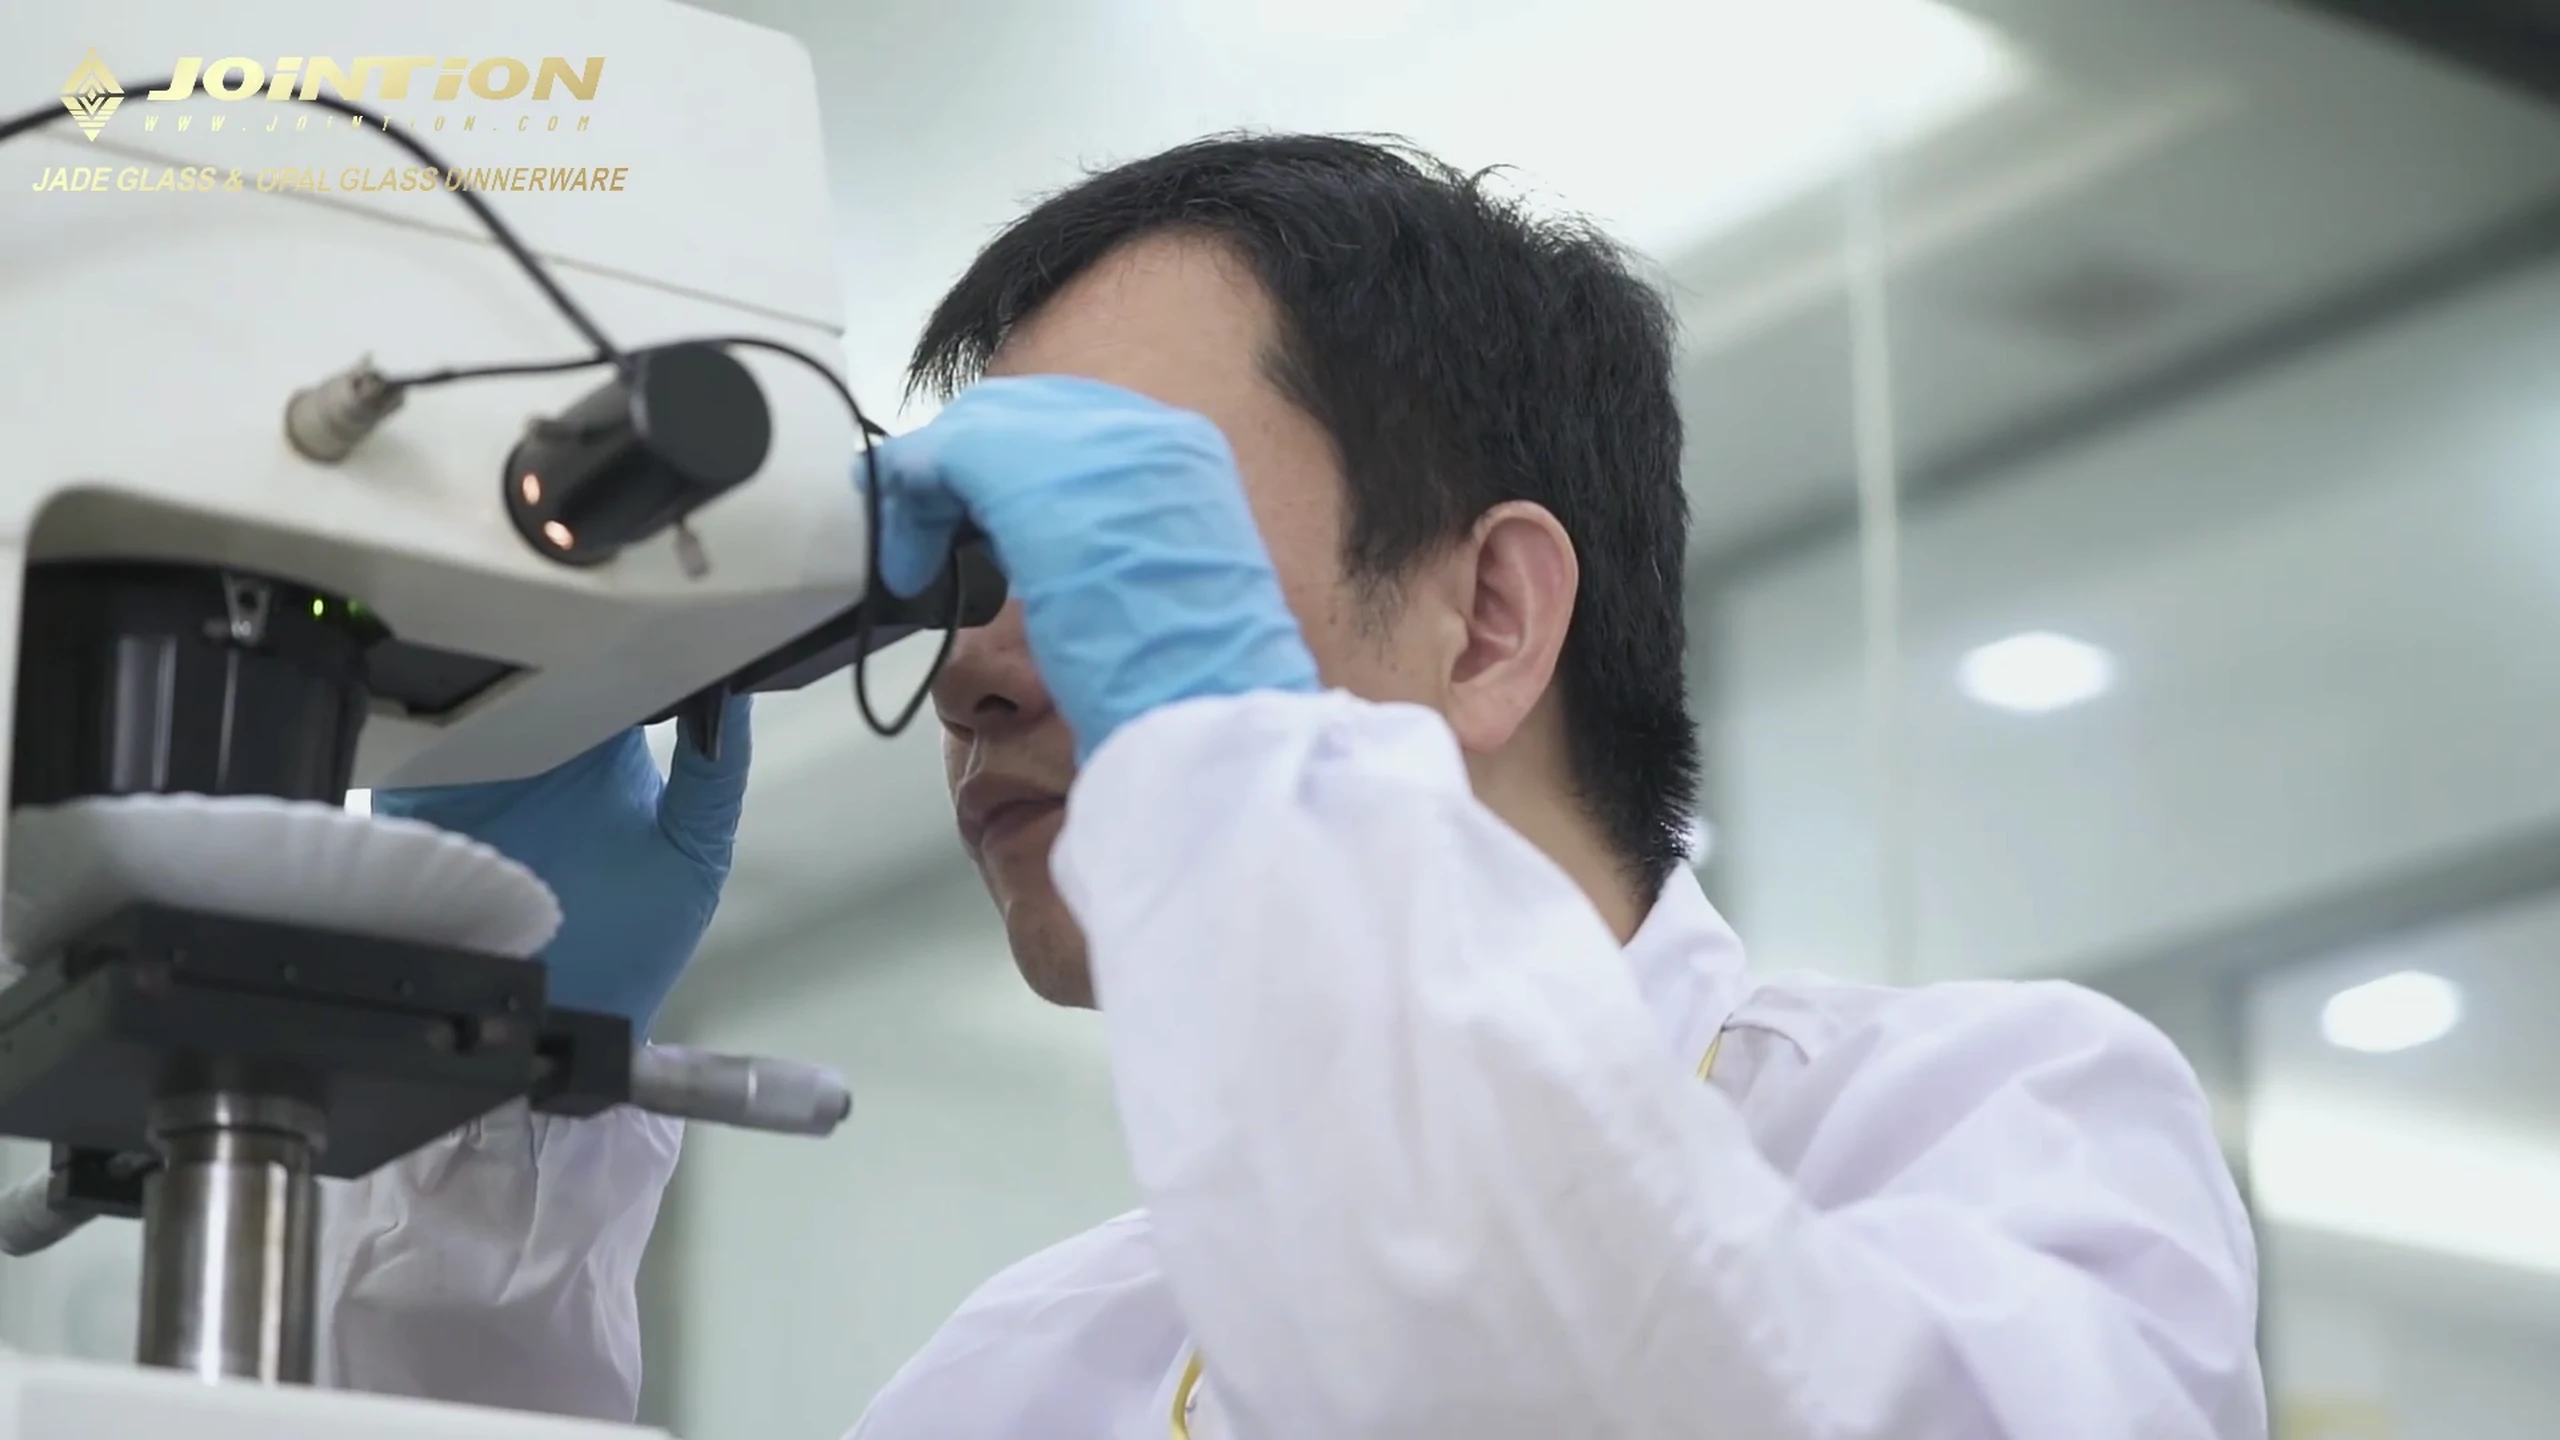
The image below shows QC staff examining an opal glass sample’s microcrystalline phase structure through a microscope. Grain size, distribution, and abnormal phases — all the indicators in the table above — can only be identified accurately at this scale.
What Final Checks Does JOINTION Perform Before Shipment?
Before any batch leaves the factory, JOINTION runs a complete finished-product sampling inspection. It covers five performance tests — thermal shock resistance, impact resistance, stress value, whiteness, and hardness — plus an appearance defect screening under specialized lighting. Sampling follows a strict AQL sampling inspection tableware protocol. After testing, every batch must hit a clear acceptance-rate threshold to ship. Fatal defects mean zero tolerance — those pieces are scrapped and re-melted. If the batch as a whole falls short, it is held for 100% re-inspection. No wiggle room.
Below is what gets tested, how the call is made, and what happens to goods that do not pass.
Complete Performance Testing on Every Batch Before Shipment
Before packing, JOINTION pulls a random sample from each batch using AQL standards — typically General Inspection Level II, the default in international trade. Samples are not grabbed from the top of a few cartons. They are drawn from different carton numbers and different layers so the pull actually represents the whole batch.
For a 5,000-piece batch, the sample size lands around 200 units. That number comes from statistical methodology, not gut feel. Testing splits into two tracks: performance safety and appearance quality.
Performance Safety Testing:
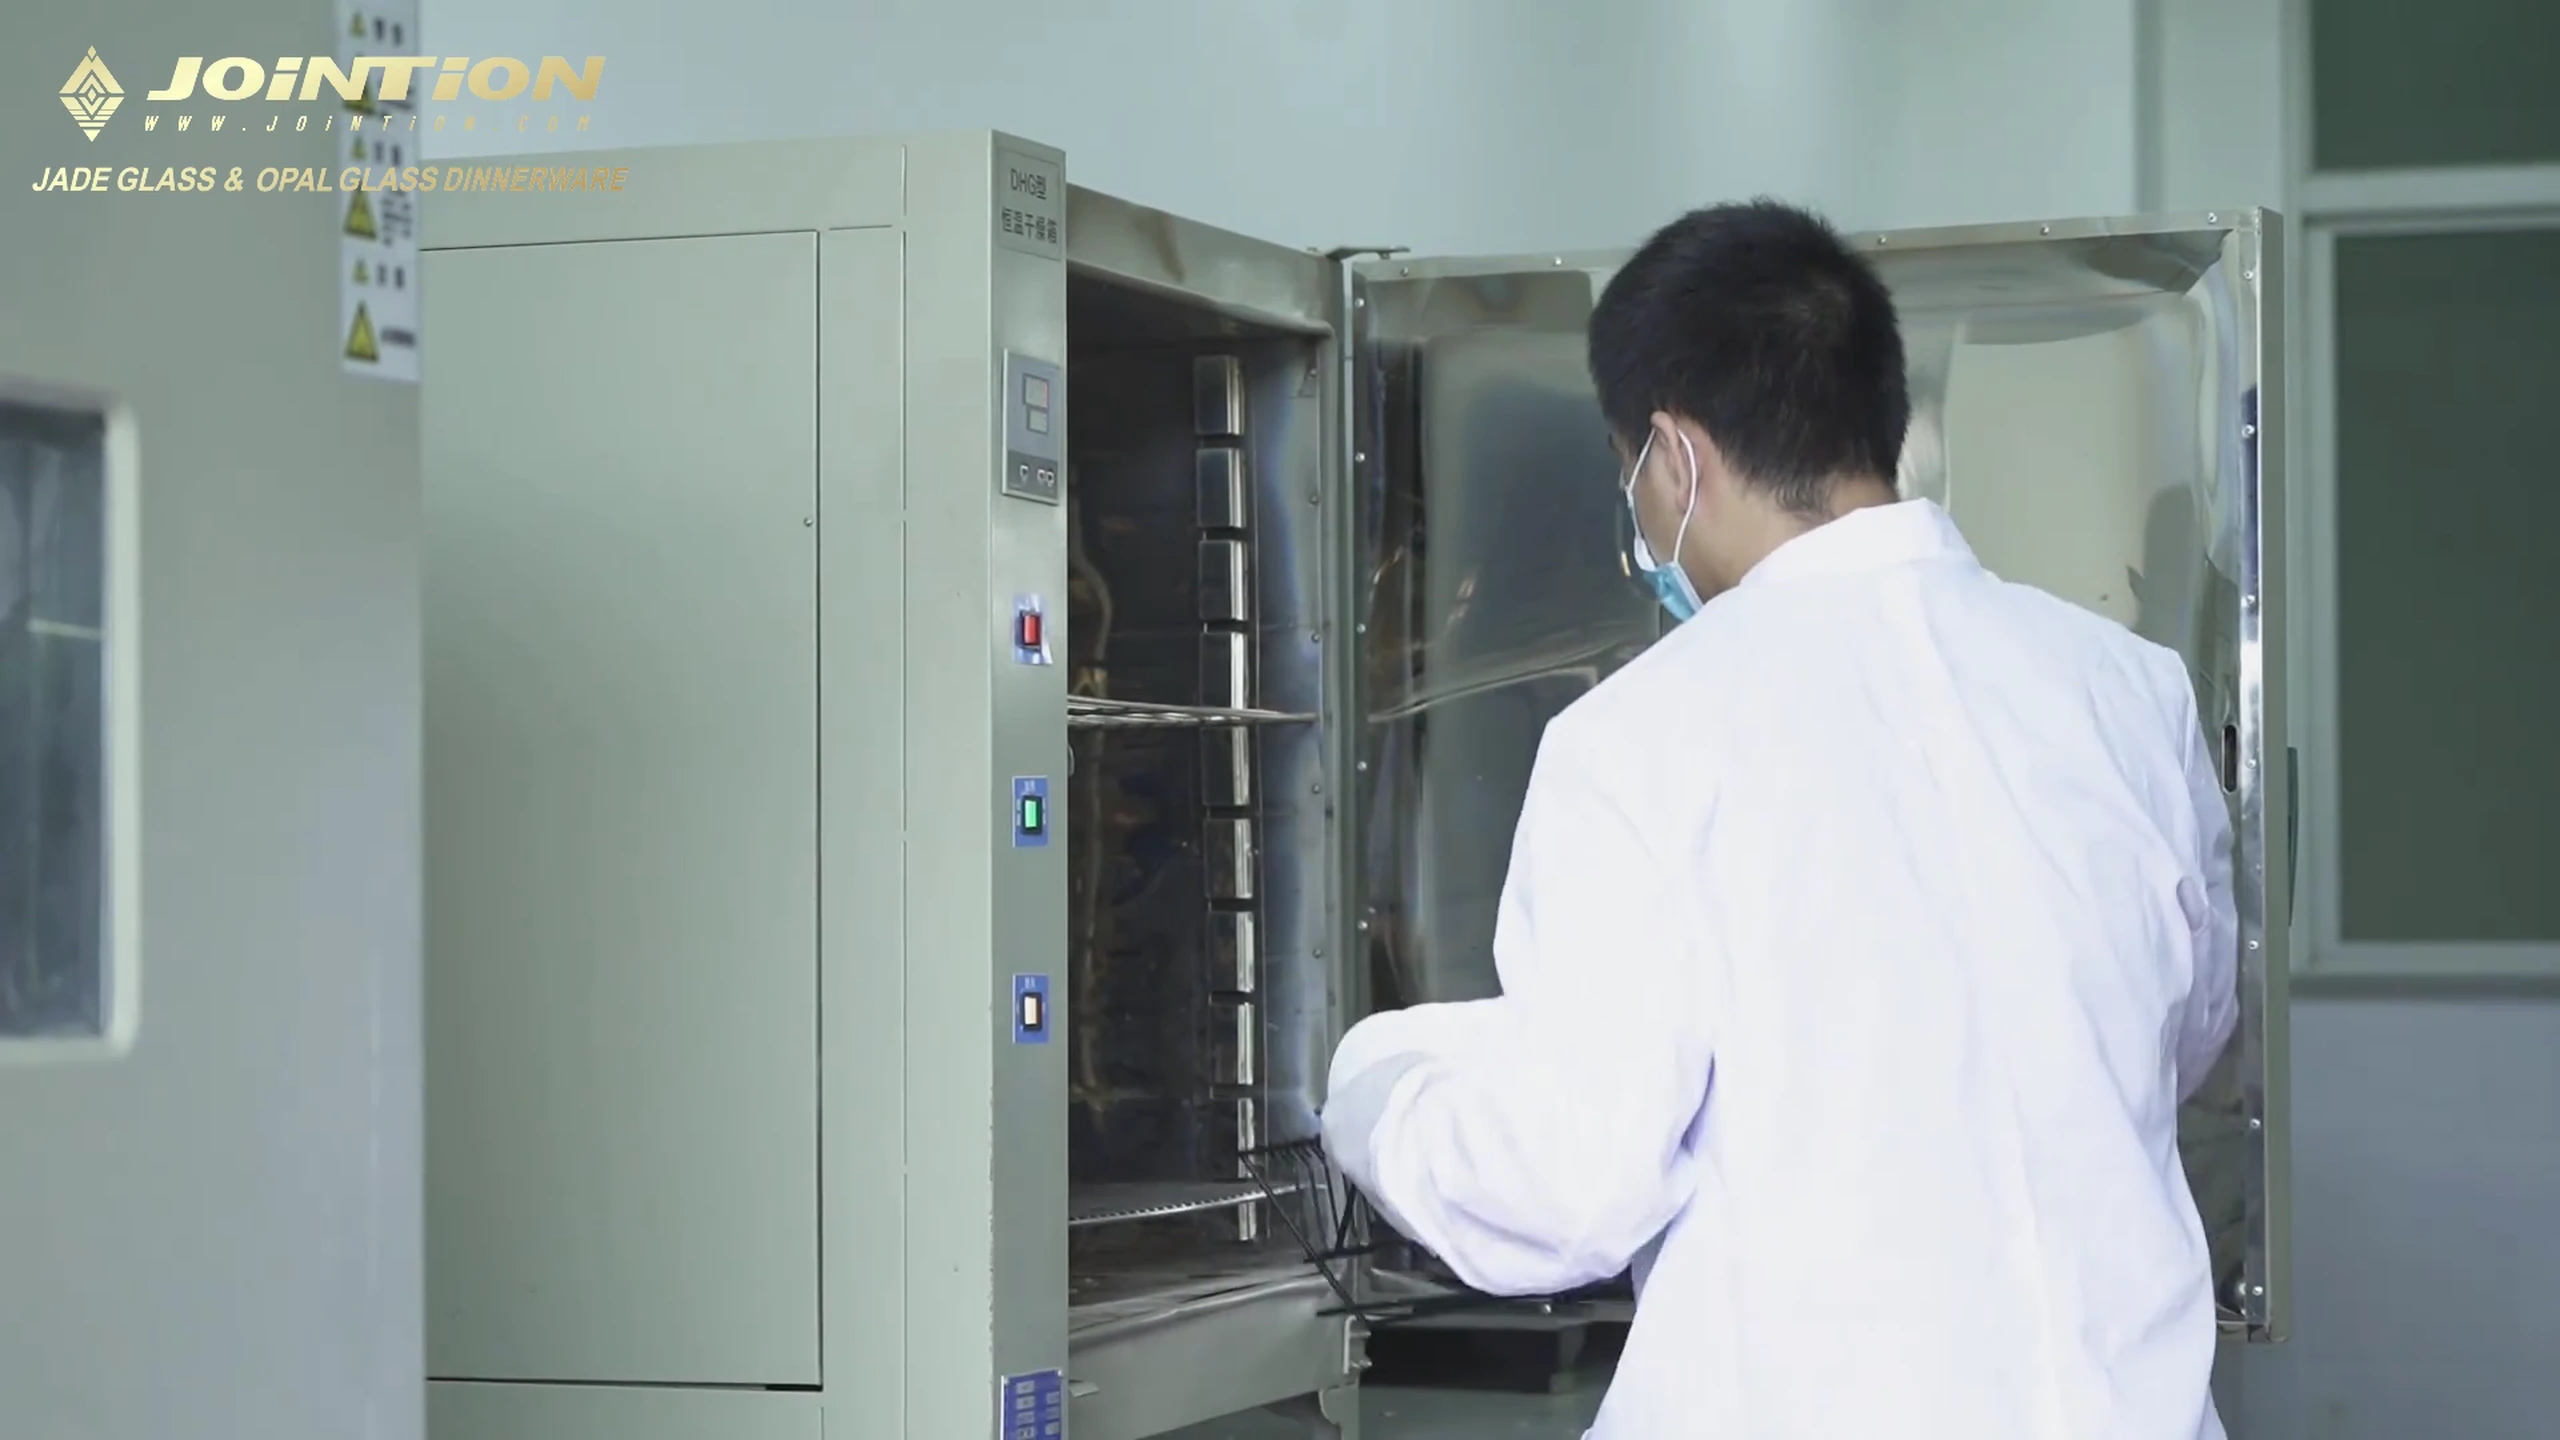
Thermal Shock Resistance (Core Safety Gate): This carries the most weight in the entire pre-shipment suite. The product line is marketed as safe for microwave ovens, conventional ovens, and dishwashers — the QC team has to prove that claim on every batch through destructive sampling. Finished pieces go into an oven, heat to a set high temperature, then get plunged straight into cold water. That simulates the harshest rapid-heat-to-cold swing a household can produce. If any piece in the sample cracks, the batch is held.
Impact Strength: This simulates the bumps and drops of daily use — confirming the product will not shatter from a normal collision. It directly backs up the core claim that opal glass is 2–3 times stronger than ordinary glass.
Stress Value: A polarized light stress meter checks whether residual internal stress sits within the safe band. High stress means annealing did not fully release the tension inside the glass. Down the road, the piece could crack out of nowhere with zero warning. This hazard is invisible — only instrumentation catches it.
Whiteness and Surface Hardness: Whiteness has to meet export-grade standards. The competitive edge of opal glass tableware rides heavily on that even, bright milky white — miss the mark and the product loses on the shelf at first glance. Surface hardness must hold up against daily knife-and-fork contact so no visible scratches develop over time.
Appearance Quality Inspection:
Surface Defect Screening (Final Visual Filter): Before packaging, inspectors check each sampled piece one by one under specialized lighting, using magnification to spot micro-bubbles, surface unevenness, flow lines, black spots, inclusions, color shifts, warping, and edge burrs. Every defect is graded by severity.
Fatal defects — cracks, chips, sharp edges — sit at AQL 0. One in 200 and the batch faces rejection. Major defects — visible bubbles over 2 mm, clearly misaligned decals, bases that wobble — stay within AQL 2.5. Minor defects — tiny bubbles, hairline scratches that do not affect function — must land within AQL 4.0. Go over on any tier and the batch fails.
At last year’s Canton Fair, a long-standing buyer from Mumbai walked up to the booth and described how he inspects goods: pull six plates at random, stack them, hold them against the light to check color consistency, then tap each one with a fingernail and listen to the ring. “I don’t need you to tell me the whiteness number,” he said. “My eyes seeing consistency is enough.” That lines up exactly with what the pre-shipment tests are designed to verify.
Clear Pass/Fail Criteria That Determine Whether a Batch Ships
Once the data is in, nobody eyeballs it and says “close enough.” Every batch runs through a fixed judgment sequence — from individual defect disposition all the way up to batch-level release. Here is how each level works:
| Step | What the Rule Says | What Actually Happens |
|---|---|---|
| Defect Count vs. AQL Table | Detected counts per defect tier are checked against the “accept” and “reject” numbers on the AQL sampling table, line by line | Any single tier over the reject line blocks the entire batch from shipping — “almost passed” does not exist |
| Fatal Defects | Cracking in thermal shock tests, cracks or chips found during visual check — zero tolerance | Those pieces are scrapped outright, no downgrade option; all cullet goes back into the furnace for 100% raw material recovery |
| Major / Minor Defects | Graded by severity | Non-conforming pieces are pulled and quarantined; scrap what needs scrapping; reworkable items (e.g., edge burr grinding) go through rework then re-inspection — only pieces that pass re-enter the batch |
| Batch Below Acceptance Rate | “Pick out the bad ones and ship the rest” is not allowed | Entire batch is held; 100% re-inspection starts — every single piece re-examined, not just a few extra samples; must clear the full release process again from scratch |
| Still Below After Re-inspection | Acceptance level remains insufficient after 100% re-check | Batch is sealed and withheld; QC traces the root cause, then decides: rework or scrap the whole lot for re-melting |
The logic is blunt: the standard is the standard. “Ship or hold” is never a judgment call — it is a data outcome. Every batch a buyer receives has already cleared this filter before it leaves the factory.
This is not a system that shows up only at final inspection. It is a closed-loop opal glass manufacturing quality assurance chain running from raw material admission through pre-shipment release. For buyers, that means every batch of opal glass tableware has been through three layers of hard screening — raw material composition, in-process execution, and finished-product performance — before you open the carton. Quality is not a promise. It is what comes out the other side of every gate.
Everything described above — the AAS raw material screening, the high-temperature pilot melt, the microscopic crystalline phase verification, and the pre-shipment thermal shock and appearance checks — is documented on camera. The video below walks through each checkpoint inside JOINTION’s own lab and production floor, so you can see the equipment, the sample handling, and the pass/fail decision points firsthand instead of taking our word for it.
Ready to see what product categories are available and which channels each one fits? Head to the Opal Glass Tableware Product Guide.
Common Questions People Ask
Q1: I already run my own third-party inspection. Do I still need to care about whether my supplier has in-process QC?
Third-party inspection is an end-point spot check. It tells you whether a batch passes or fails. It cannot trace which step caused the problem, and it cannot stop the same issue from showing up in the next shipment. When a supplier runs its own full-process quality system — raw materials through finished goods — problems get caught and fixed inside the production line. Your pass rate stabilizes, and your return rate drops. The two approaches are complementary, not interchangeable.
Q2: Quotes from different suppliers are 15%–20% apart on opal glass. Does a lower price always mean worse quality?
Not necessarily in what you see on the surface — but almost certainly in what you cannot see. The most common cost cuts are raw material grade and skipped testing: cheaper silica sand with higher iron, no AAS screening before feeding, no microstructure check after annealing. Short-term, the product may look fine. Long-term, it shows up as color-difference complaints, in-use cracking, and batch-to-batch whiteness drift. When you compare quotes, put each supplier’s testing capability and interception rules on the table next to the FOB price — not just the price alone.